While there are volumes of discourse on the topic, it can’t be overstated how important custom application metrics are. Unlike the core service metrics you’ll want to collect for your Django application (application and web server stats, key DB and cache operational metrics), custom metrics are data points unique to your domain with bounds and thresholds known only by you. In other words, it’s the fun stuff.
How might these metrics be useful? Consider:
- You run an ecomm website and track average order size. Suddenly that order size isn’t so average. With solid application metrics and monitoring you can catch the bug before it breaks the bank.
- You’re writing a scraper that pulls the most recent articles from a news website every hour. Suddenly the most recent articles aren’t so recent. Solid metrics and monitoring will reveal the breakage earlier.
- I 👏 Think 👏 You 👏 Get 👏 The 👏 Point 👏
Setting up the Django Application
Besides the obvious dependencies (looking at you pip install Django), we’ll need some additional packages for our pet project. Go ahead and pip install django-prometheus-client. This will give us a Python Prometheus client to play with, as well as some helpful Django hooks including middleware and a nifty DB wrapper. Next we’ll run the Django management commands to start a project and app, update our settings to utilize the Prometheus client, and add Prometheus URLs to our URL conf.
Start a new project and app
For the purposes of this post, and in fitting with our agency brand, we’ll be building a dog walking service. Mind you, it won’t actually do much, but should suffice to serve as a teaching tool. Go ahead and execute:
django-admin.py startproject demo
python manage.py startapp walker
#settings.py
INSTALLED_APPS = [
...
'walker',
...
]Now, we’ll add some basic models and views. For the sake of brevity, I’ll only include implementation for the portions we’ll be instrumenting, but if you’d like to follow along in full just grab the demo app source.
# walker/models.py
from django.db import models
from django_prometheus.models import ExportModelOperationsMixin


class Walker(ExportModelOperationsMixin('walker'), models.Model):
    name = models.CharField(max_length=127)
    email = models.CharField(max_length=127)

    def __str__(self):
        return f'{self.name} // {self.email} ({self.id})'


class Dog(ExportModelOperationsMixin('dog'), models.Model):
    SIZE_XS = 'xs'
    SIZE_SM = 'sm'
    SIZE_MD = 'md'
    SIZE_LG = 'lg'
    SIZE_XL = 'xl'
    DOG_SIZES = (
        (SIZE_XS, 'xsmall'),
        (SIZE_SM, 'small'),
        (SIZE_MD, 'medium'),
        (SIZE_LG, 'large'),
        (SIZE_XL, 'xlarge'),
    )

    size = models.CharField(max_length=31, choices=DOG_SIZES, default=SIZE_MD)
    name = models.CharField(max_length=127)
    age = models.IntegerField()

    def __str__(self):
        return f'{self.name} // {self.age}y ({self.size})'


class Walk(ExportModelOperationsMixin('walk'), models.Model):
    dog = models.ForeignKey(Dog, related_name='walks', on_delete=models.CASCADE)
    walker = models.ForeignKey(Walker, related_name='walks', on_delete=models.CASCADE)

    distance = models.IntegerField(default=0, help_text='walk distance (in meters)')

    start_time = models.DateTimeField(null=True, blank=True, default=None)
    end_time = models.DateTimeField(null=True, blank=True, default=None)

    @property
    def is_complete(self):
        return self.end_time is not None

    @classmethod
    def in_progress(cls):
        """ get the list of `Walk`s currently in progress """
        return cls.objects.filter(start_time__isnull=False, end_time__isnull=True)

    def __str__(self):
        return f'{self.walker.name} // {self.dog.name} @ {self.start_time} ({self.id})'
# walker/views.py
from django.shortcuts import render, redirect
from django.views import View
from django.core.exceptions import ObjectDoesNotExist
from django.http import HttpResponseNotFound, JsonResponse, HttpResponseBadRequest, Http404
from django.urls import reverse
from django.utils.timezone import now
from walker import models, forms
class WalkDetailsView(View):
def get_walk(self, walk_id=None):
try:
return models.Walk.objects.get(id=walk_id)
except ObjectDoesNotExist:
raise Http404(f'no walk with ID {walk_id} in progress')
class CheckWalkStatusView(WalkDetailsView):
def get(self, request, walk_id=None, **kwargs):
walk = self.get_walk(walk_id=walk_id)
return JsonResponse({'complete': walk.is_complete})
class CompleteWalkView(WalkDetailsView):
def get(self, request, walk_id=None, **kwargs):
walk = self.get_walk(walk_id=walk_id)
return render(request, 'index.html', context={'form': forms.CompleteWalkForm(instance=walk)})
def post(self, request, walk_id=None, **kwargs):
try:
walk = models.Walk.objects.get(id=walk_id)
except ObjectDoesNotExist:
return HttpResponseNotFound(content=f'no walk with ID {walk_id} found')
if walk.is_complete:
return HttpResponseBadRequest(content=f'walk {walk.id} is already complete')
form = forms.CompleteWalkForm(data=request.POST, instance=walk)
if form.is_valid():
updated_walk = form.save(commit=False)
updated_walk.end_time = now()
updated_walk.save()
return redirect(f'{reverse("walk_start")}?walk={walk.id}')
return HttpResponseBadRequest(content=f'form validation failed with errors {form.errors}')
class StartWalkView(View):
def get(self, request):
return render(request, 'index.html', context={'form': forms.StartWalkForm()})
def post(self, request):
form = forms.StartWalkForm(data=request.POST)
if form.is_valid():
walk = form.save(commit=False)
walk.start_time = now()
walk.save()
return redirect(f'{reverse("walk_start")}?walk={walk.id}')
return HttpResponseBadRequest(content=f'form validation failed with errors {form.errors}')Update app settings and add Prometheus urls
Now that we have a Django project and app setup, it’s time to add the required settings for django-prometheus. In settings.py , apply the following:
INSTALLED_APPS = [
    ...
    'django_prometheus',
    ...
]

MIDDLEWARE = [
    'django_prometheus.middleware.PrometheusBeforeMiddleware',
    ....
    'django_prometheus.middleware.PrometheusAfterMiddleware',
]

# we're assuming a Postgres DB here because, well, that's just the right choice :)
DATABASES = {
    'default': {
        'ENGINE': 'django_prometheus.db.backends.postgresql',
        'NAME': os.getenv('DB_NAME'),
        'USER': os.getenv('DB_USER'),
        'PASSWORD': os.getenv('DB_PASSWORD'),
        'HOST': os.getenv('DB_HOST'),
        'PORT': os.getenv('DB_PORT', '5432'),
    },
}
and add the following to your urls.py
urlpatterns = [
    ...
    path('', include('django_prometheus.urls')),
]
At this point, we have a basic application configured and primed for instrumentation.
Instrument the Code with Prometheus Metrics
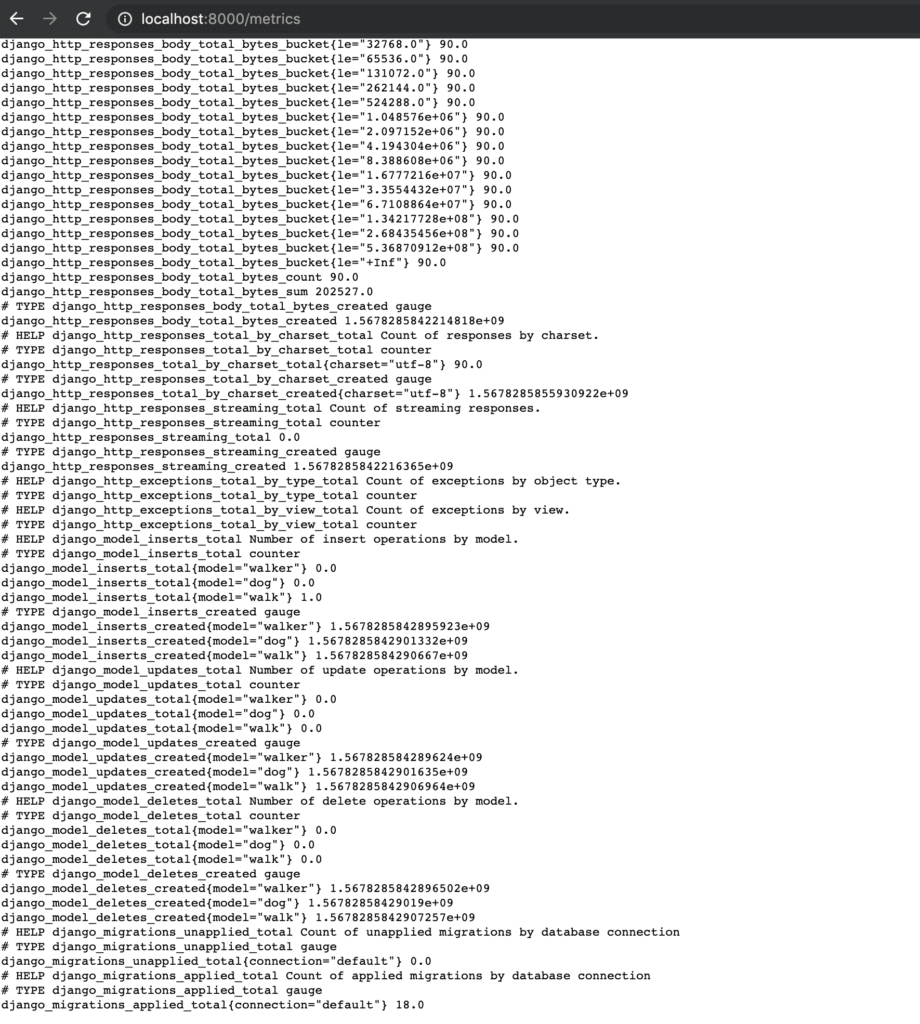
As a result of out of box functionality provided by django-prometheus , we immediately have basic model operations, like insertions and deletions, tracked. You can see this in action at the /metrics endpoint where you’ll have something like:

default metrics provided by django-prometheus
Let’s make this a bit more interesting.
Start by adding a walker/metrics.py where we’ll define some basic metrics to track.
# walker/metrics.py
from prometheus_client import Counter, Histogram


walks_started = Counter('walks_started', 'number of walks started')
walks_completed = Counter('walks_completed', 'number of walks completed')
invalid_walks = Counter('invalid_walks', 'number of walks attempted to be started, but invalid')

walk_distance = Histogram('walk_distance', 'distribution of distance walked', buckets=[0, 50, 200, 400, 800, 1600, 3200])
Painless, eh? The Prometheus documentation does a good job explaining what each of the metric types should be used for, but in short we are using counters to represent metrics that are strictly increasing over time and histograms to track metrics that contain a distribution of values we want tracked. Let’s start instrumenting our application code.
# walker/views.py
...
from walker import metrics
...

class CompleteWalkView(WalkDetailsView):
    ...
    def post(self, request, walk_id=None, **kwargs):
        ...
        if form.is_valid():
            updated_walk = form.save(commit=False)
            updated_walk.end_time = now()
            updated_walk.save()

            metrics.walks_completed.inc()
            metrics.walk_distance.observe(updated_walk.distance)

            return redirect(f'{reverse("walk_start")}?walk={walk.id}')

        return HttpResponseBadRequest(content=f'form validation failed with errors {form.errors}')

...

class StartWalkView(View):
    ...
    def post(self, request):
        if form.is_valid():
            walk = form.save(commit=False)
            walk.start_time = now()
            walk.save()

            metrics.walks_started.inc()

            return redirect(f'{reverse("walk_start")}?walk={walk.id}')

        metrics.invalid_walks.inc()

        return HttpResponseBadRequest(content=f'form validation failed with errors {form.errors}')
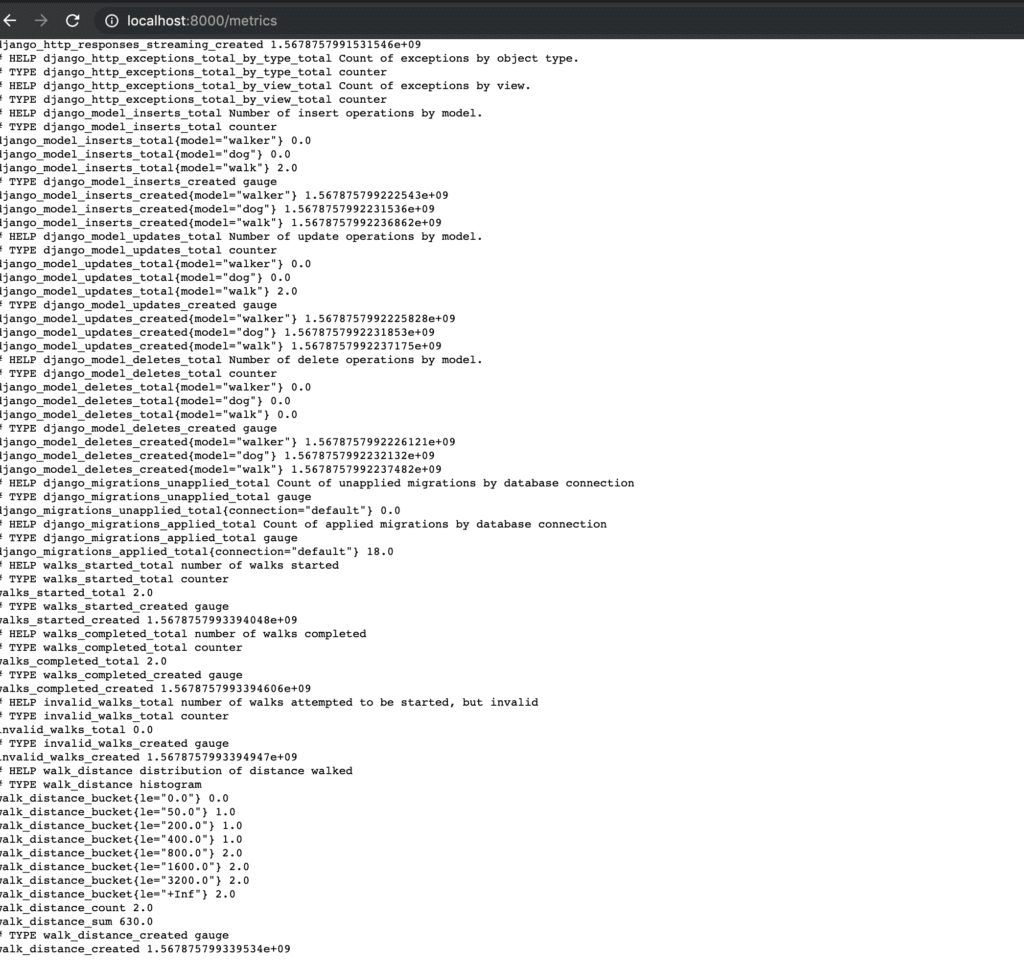
If we make a few sample requests, we’ll be able to see the new metrics flowing through the endpoint.

peep the walk distance and created walks metrics

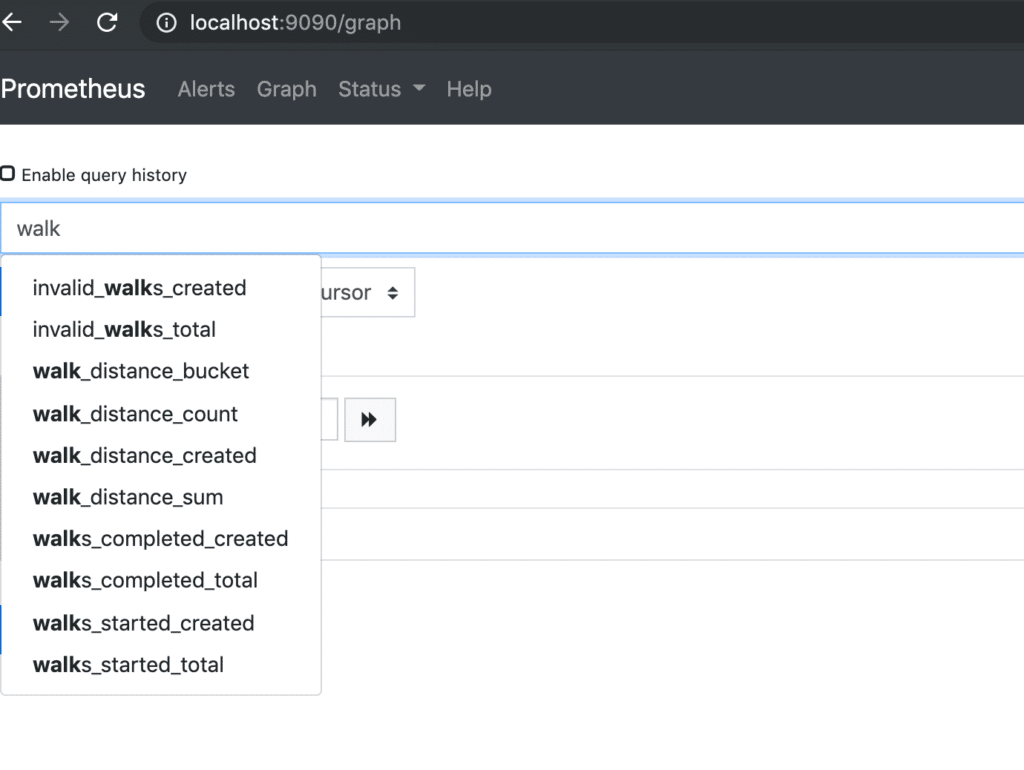
our metrics are now available for graphing in prometheus
By this point we’ve defined our custom metrics in code, instrumented the application to track these metrics, and verified that the metrics are updated and available at the /metrics
Deploying the Application With Helm
I’ll keep this part brief and limited only to configuration relevant to metric tracking and exporting, but the full Helm chart with complete deployment and service configuration may be found in the demo app. As a jumping off point, here’s some snippets of the deployment and configmap highlighting portions with significance towards metric exporting.
# helm/demo/templates/nginx-conf-configmap.yaml
apiVersion: v1
kind: ConfigMap
metadata:
  name: {{ include "demo.fullname" . }}-nginx-conf
  ...
data:
  demo.conf: |
    upstream app_server {
      server 127.0.0.1:8000 fail_timeout=0;
    }

    server {
      listen 80;
      client_max_body_size 4G;

      # set the correct host(s) for your site
      server_name{{ range .Values.ingress.hosts }} {{ . }}{{- end }};

      keepalive_timeout 5;

      root /code/static;

      location / {
        # checks for static file, if not found proxy to app
        try_files $uri @proxy_to_app;
      }

      location ^~ /metrics {
        auth_basic           "Metrics";
        auth_basic_user_file /etc/nginx/secrets/.htpasswd;

        proxy_pass http://app_server;
      }

      location @proxy_to_app {
        proxy_set_header X-Forwarded-For $proxy_add_x_forwarded_for;
        proxy_set_header X-Forwarded-Proto $scheme;
        proxy_set_header Host $http_host;
        # we don't want nginx trying to do something clever with
        # redirects, we set the Host: header above already.
        proxy_redirect off;
        proxy_pass http://app_server;
      }
    }
# helm/demo/templates/deployment.yaml
apiVersion: apps/v1
kind: Deployment
...
spec:
metadata:
labels:
app.kubernetes.io/name: {{ include "demo.name" . }}
app.kubernetes.io/instance: {{ .Release.Name }}
app: {{ include "demo.name" . }}
volumes:
...
- name: nginx-conf
configMap:
name: {{ include "demo.fullname" . }}-nginx-conf
- name: prometheus-auth
secret:
secretName: prometheus-basic-auth
...
containers:
- name: {{ .Chart.Name }}-nginx
image: "{{ .Values.nginx.image.repository }}:{{ .Values.nginx.image.tag }}"
imagePullPolicy: IfNotPresent
volumeMounts:
...
- name: nginx-conf
mountPath: /etc/nginx/conf.d/
- name: prometheus-auth
mountPath: /etc/nginx/secrets/.htpasswd
ports:
- name: http
containerPort: 80
protocol: TCP
- name: {{ .Chart.Name }}
image: "{{ .Values.image.repository }}:{{ .Values.image.tag }}"
imagePullPolicy: {{ .Values.image.pullPolicy }}
command: ["gunicorn", "--worker-class", "gthread", "--threads", "3", "--bind", "0.0.0.0:8000", "demo.wsgi:application"]
env:
{{ include "demo.env" . | nindent 12 }}
ports:
- name: gunicorn
containerPort: 8000
protocol: TCP
...Nothing too magick-y here, just your good ol’ YAML blob. There are only two important points I’d like to draw attention to:
- We put the
/metricsendpoint behind basic auth via an nginx reverse proxy with anauth_basicdirective set for the location block. While you’ll probably want to deploy gunicorn behind a reverse proxy anyway, we get the added benefit of protecting our application metrics in doing so. - We use multi-threaded gunicorn as opposed to multiple workers. While you can enable multiprocess mode for the Prometheus client, it is a more complex setup in a Kubernetes environment. Why is this important? Well, the danger in running multiple workers in a single pod is that each worker will report its own set of metric values on scrape. However, since the service is grouped to the pod level in the Prometheus Kubernetes SD scrape config, these (potentially) jumping values will be incorrectly classified as counter resets leading to inconsistent measurements. You don’t necessarily need to follow all the above, but the big Tl:Dr here is: If you don’t know better, you should probably start in either a single thread + single worker gunicorn environment, or else a single worker + multi-threaded one.
Deploying Prometheus With Helm
With the help of Helm, deploying Prometheus to the cluster is a 🍰. Without further ado:
helm upgrade --install prometheus stable/prometheusAfter a few minutes, you should be able to port-forward into the Prometheus pod (the default container port is 9090)
Configuring a Prometheus Scrape Target for the Application
The Prometheus Helm chart has a ton of customization options, but for our purposes we just need to set the extraScrapeConfigs . To do so, start by creating a values.yaml . As in most of the post, you can skip this section and just use the demo app as a prescriptive guide if you’d like. In that file, you’ll want:
extraScrapeConfigs: |
  - job_name: demo
    scrape_interval: 5s
    metrics_path: /metrics
    basic_auth:
      username: prometheus
      password: prometheus
    tls_config:
      insecure_skip_verify: true
    kubernetes_sd_configs:
      - role: endpoints
        namespaces:
          names:
            - default
    relabel_configs:
      - source_labels: [__meta_kubernetes_service_label_app]
        regex: demo
        action: keep
      - source_labels: [__meta_kubernetes_endpoint_port_name]
        regex: http
        action: keep
      - source_labels: [__meta_kubernetes_namespace]
        target_label: namespace
      - source_labels: [__meta_kubernetes_pod_name]
        target_label: pod
      - source_labels: [__meta_kubernetes_service_name]
        target_label: service
      - source_labels: [__meta_kubernetes_service_name]
        target_label: job
      - target_label: endpoint
        replacement: http
After creating the file, you should be able to apply the update to your prometheus deployment from the previous step via
helm upgrade --install prometheus -f values.yamlTo verify everything worked properly, open up your browser to http://localhost:9090/targets (assuming you’ve already port-forward ed into the running prometheus server Pod). If you see the demo app there in the target list, then that’s a big 👍.
Try It Yourself
I’m going to make a bold statement here: Capturing custom application metrics and setting up the corresponding reporting and monitoring is one of the most immediately gratifying tasks in software engineering. Luckily for us, it’s actually really simple to integrate Prometheus metrics into your Django application, as I hope this post has shown. If you’d like to start instrumenting your own app, feel free to rip configuration and ideas from the full sample application, or just fork the repo and hack away. Happy trails 🐶


